Use Cases
The General Unified World Model is designed for anyone who needs to reason about how the world works -- from hedge fund PMs to government analysts to AI agents. Each use case involves projecting to the relevant subset of fields, training on available data, and querying predictions.
Macro-Financial Risk Analysis
Who: Hedge fund PM, risk analyst, macro strategist
A hedge fund PM needs to understand recession risk, rate paths, and equity exposure given current macro conditions.
from general_unified_world_model import World, project
from general_unified_world_model.schema.business import Business
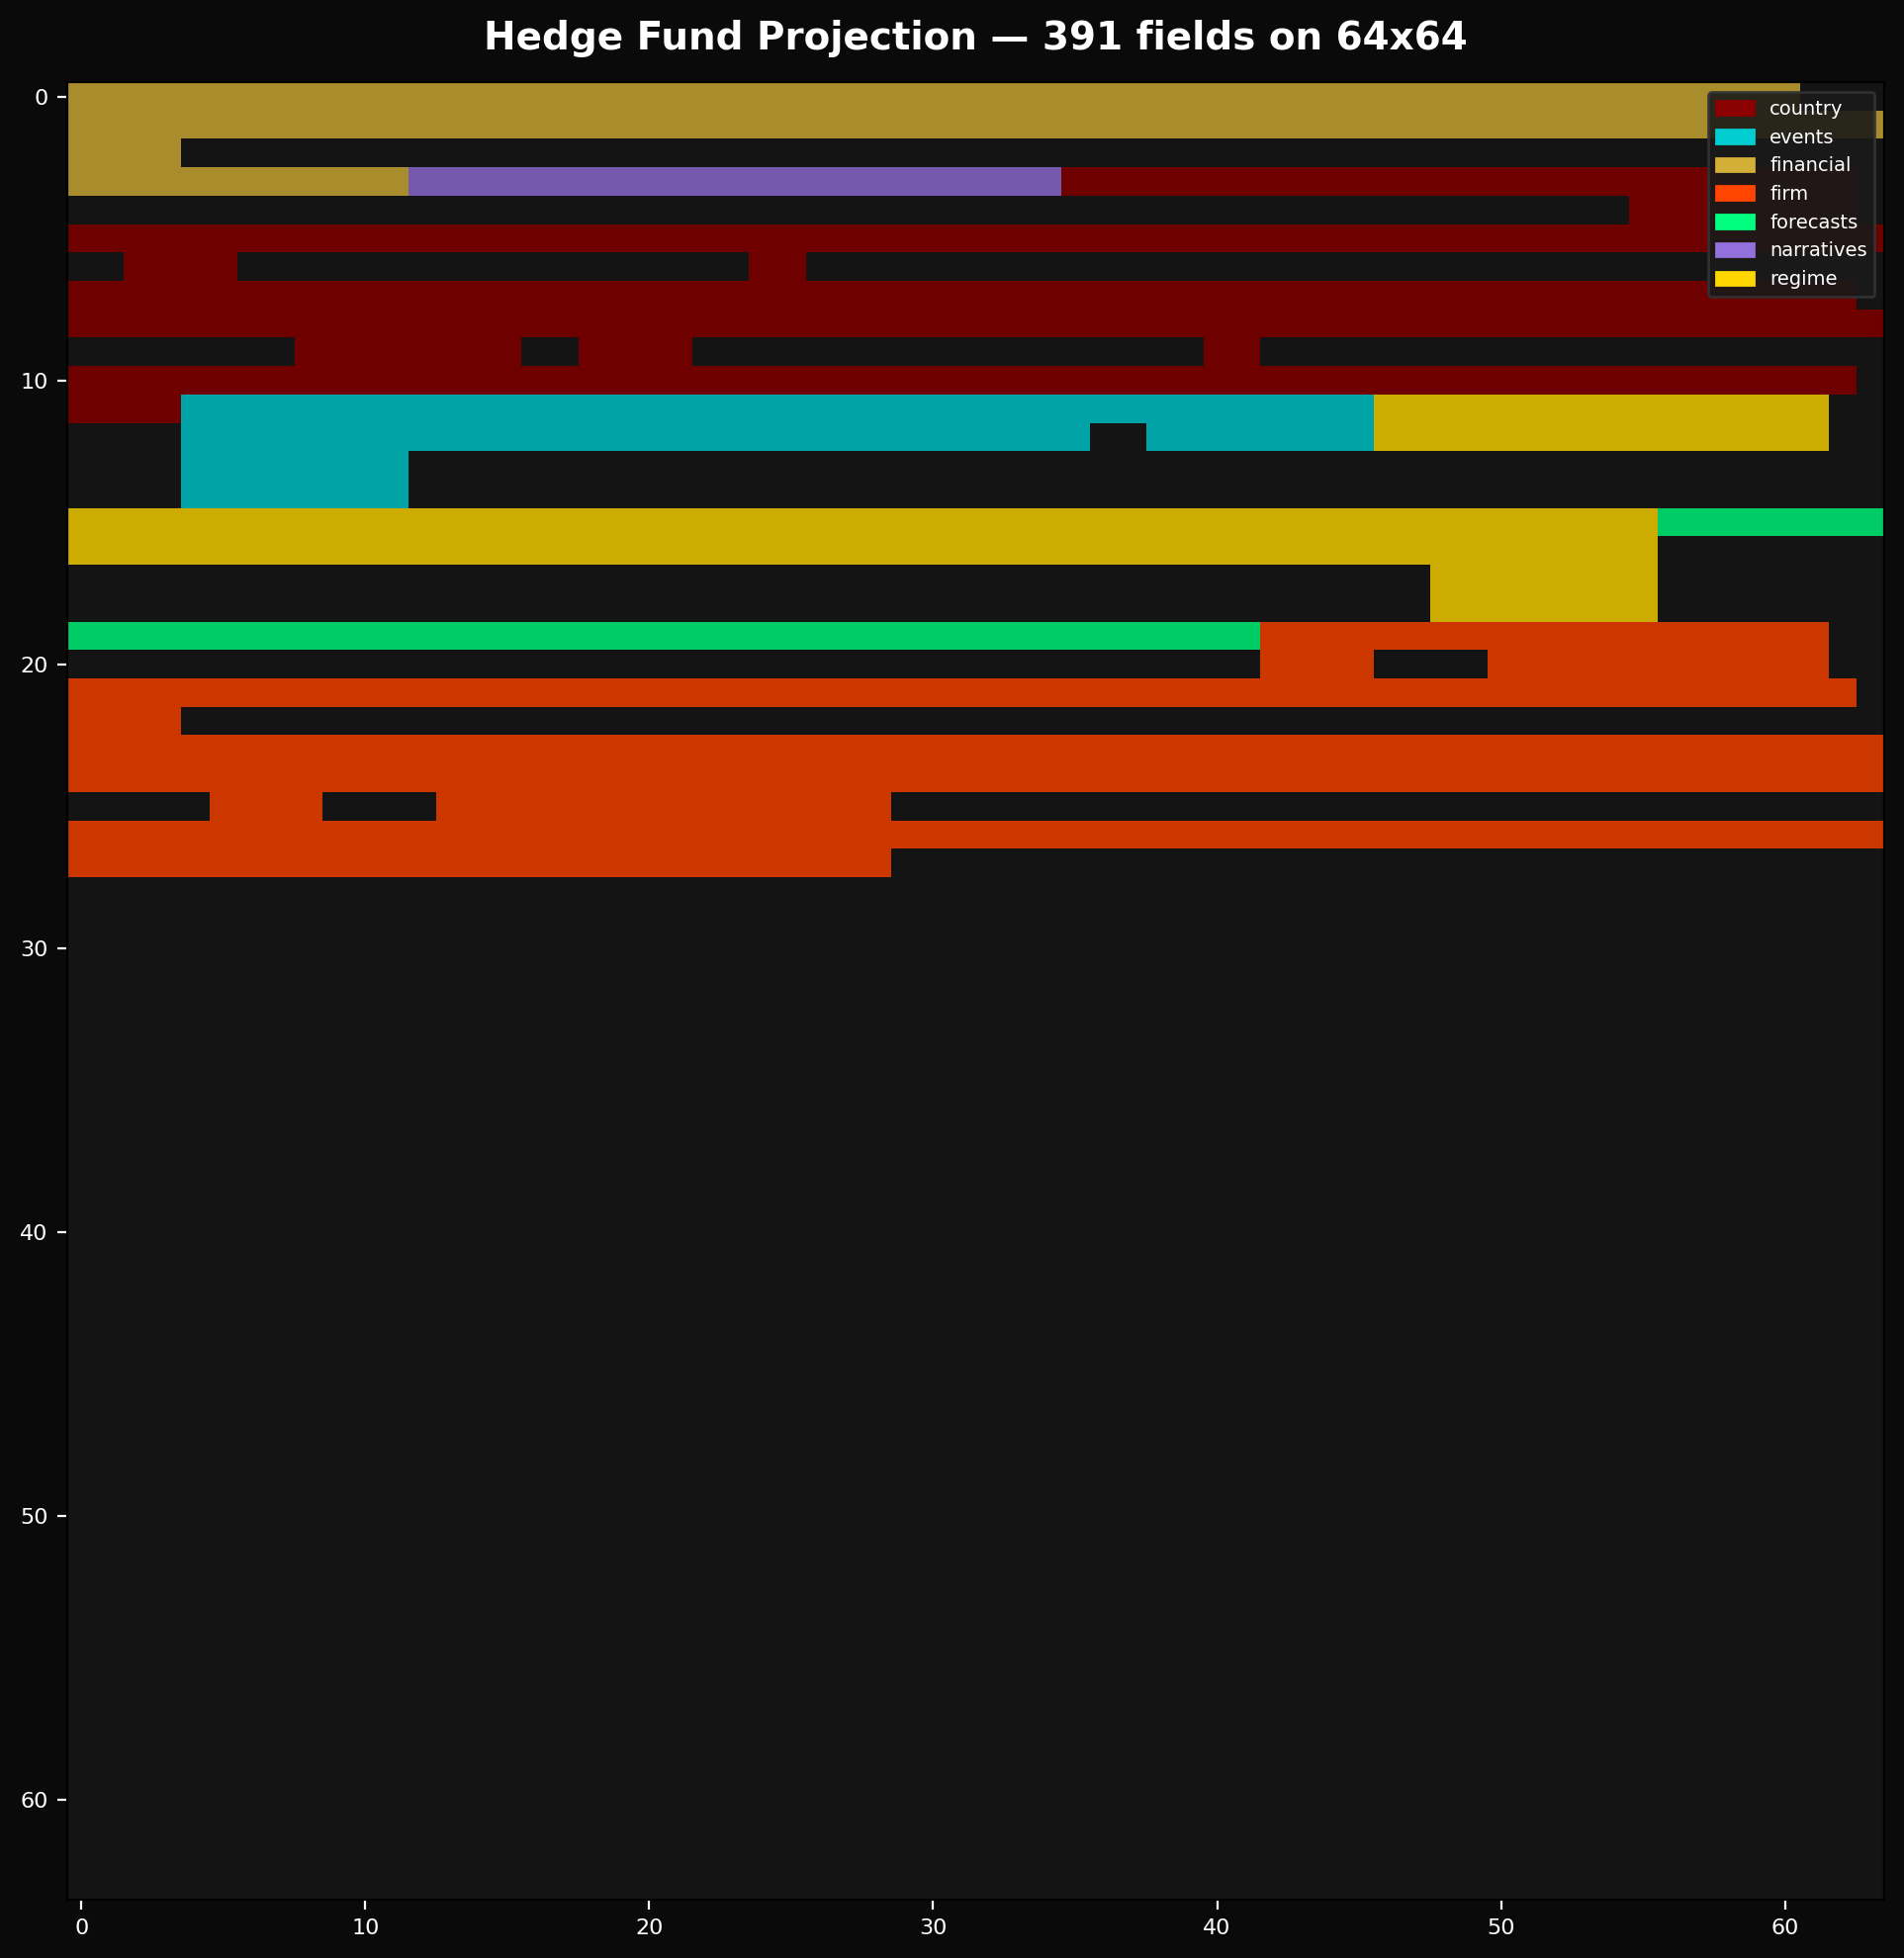
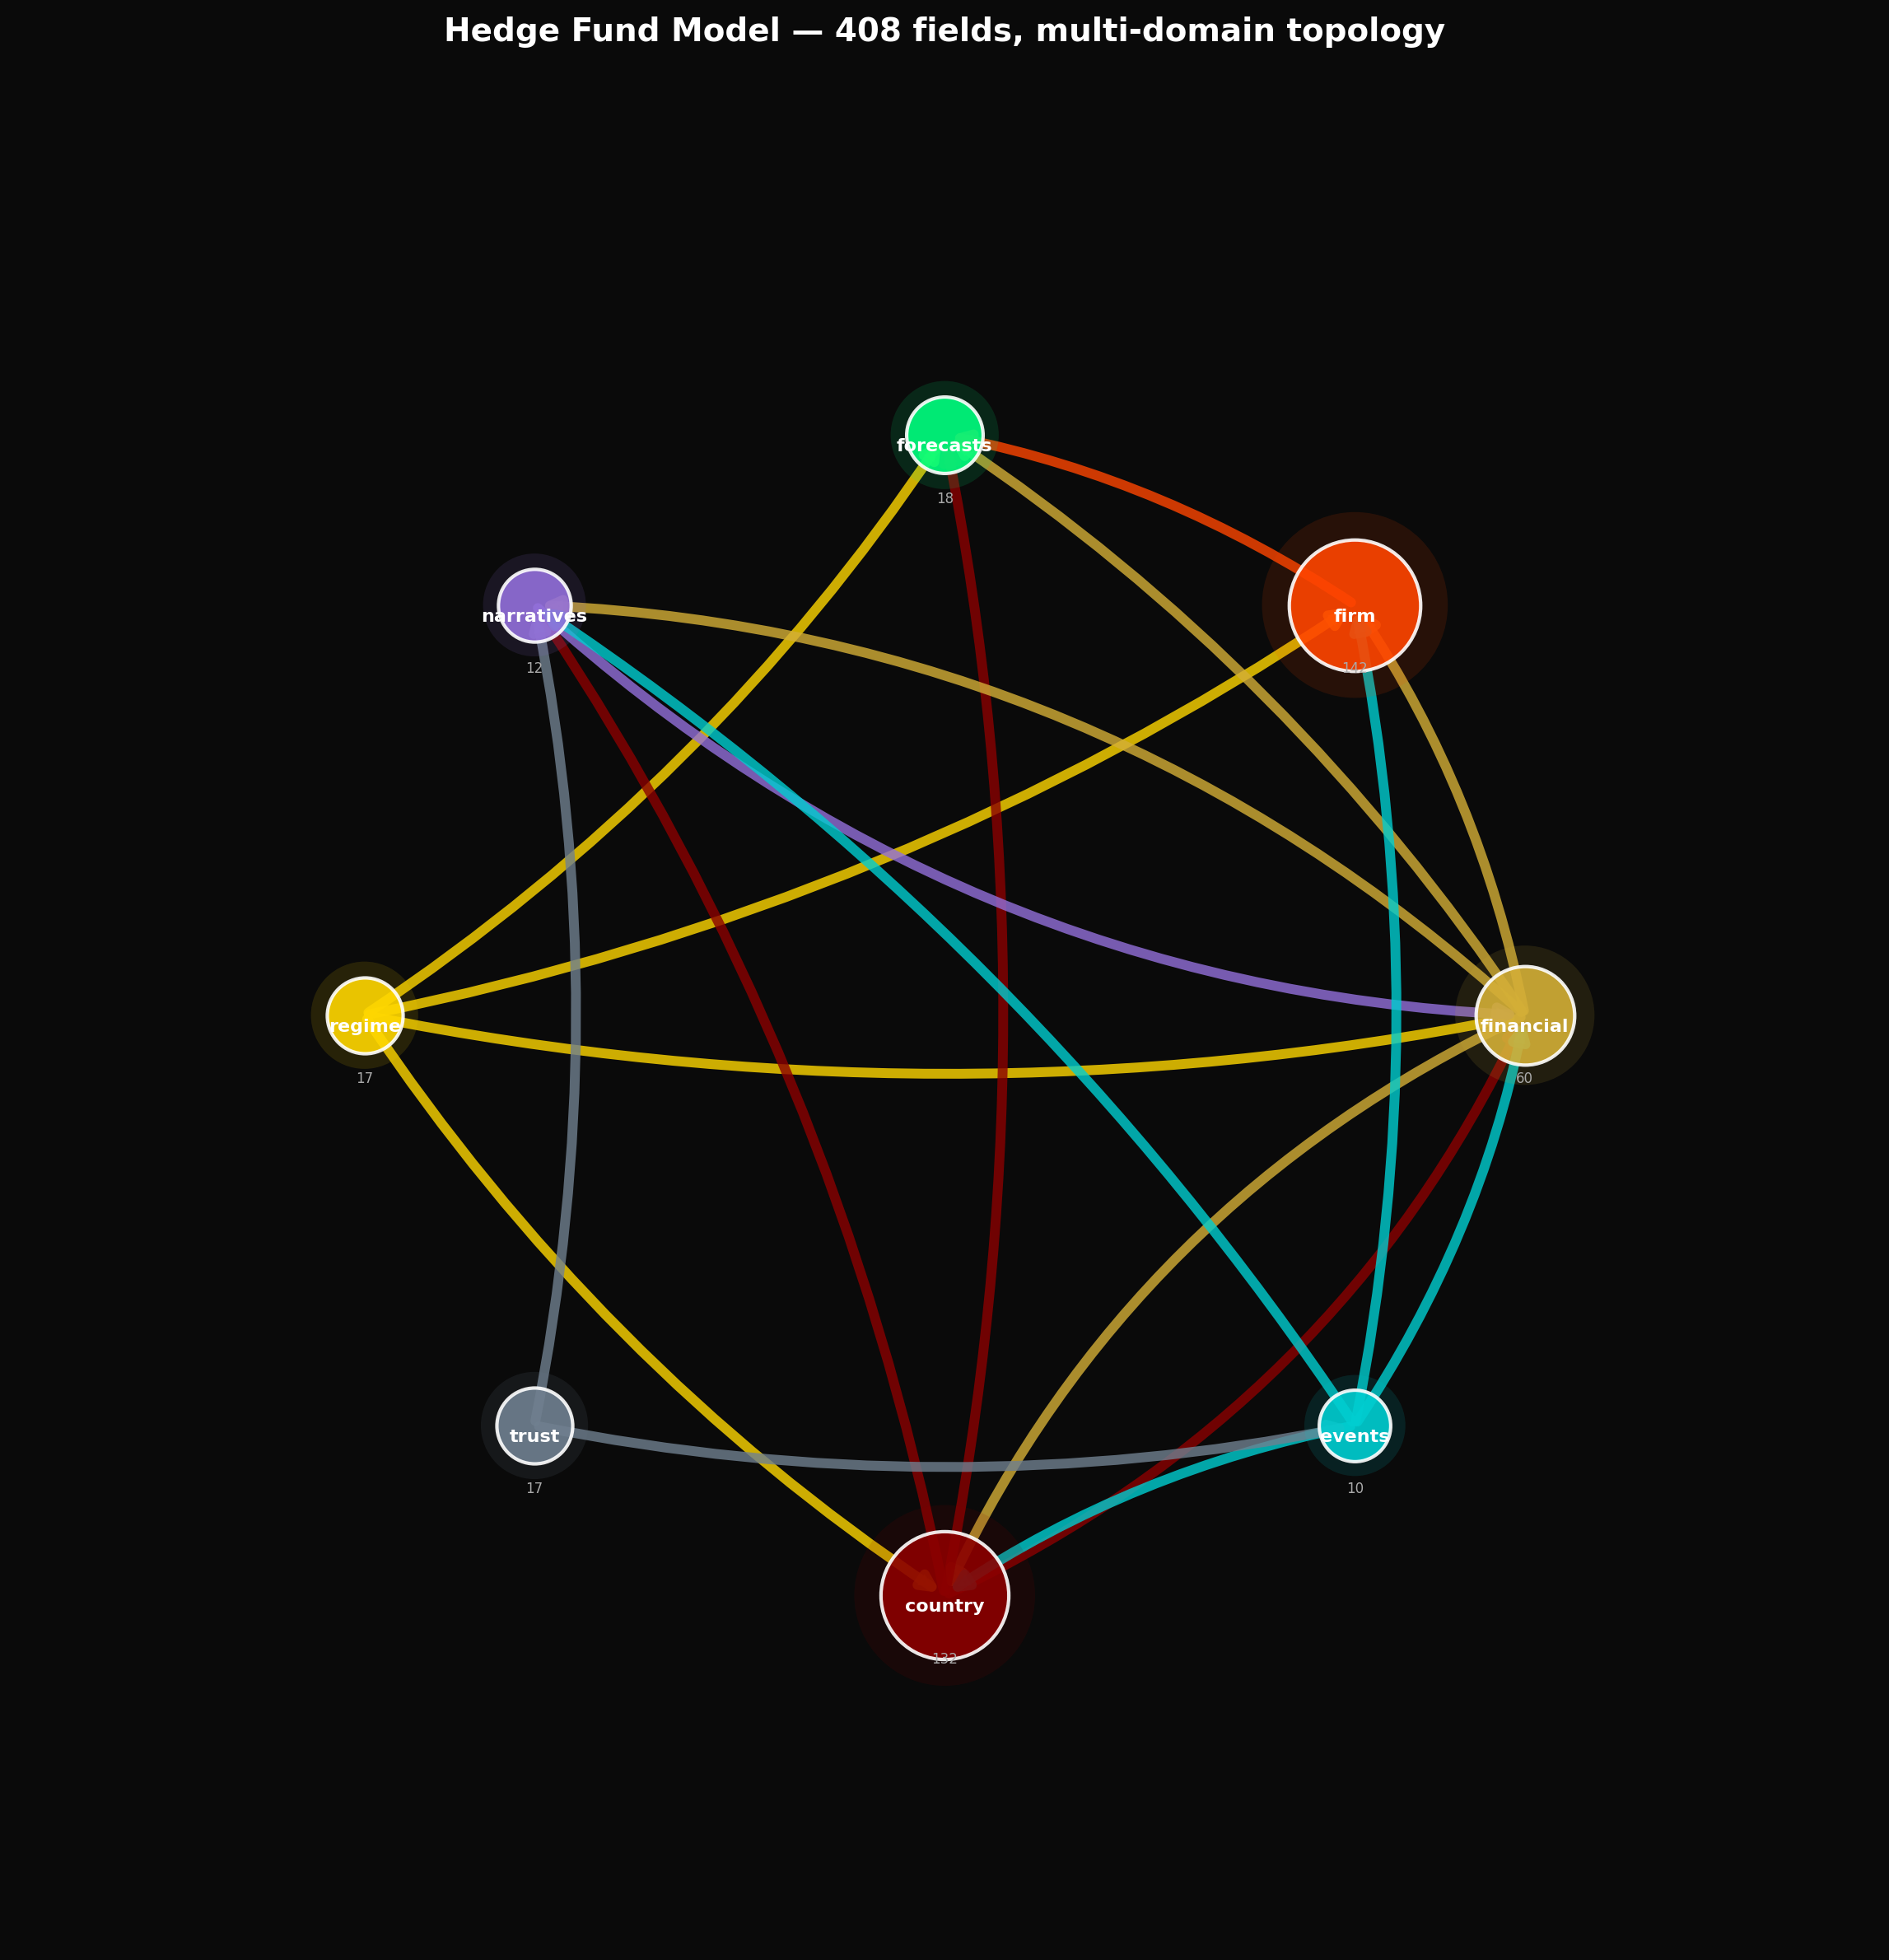
bound = project(
World(),
include=[
"financial", # yields, credit, FX, equities, crypto
"country_us.macro", # GDP, inflation, labor, housing
"regime", # growth/crisis/transition mode
"forecasts.macro", # recession probability
"forecasts.financial", # credit stress, rate path
],
entities={
"firm_AAPL": Business(),
"firm_NVDA": Business(),
"firm_JPM": Business(),
},
d_model=64,
)
graph TD
    subgraph Observe
        A["10Y Treasury: 4.25%"]
        B["CPI YoY: 3.1%"]
        C["Unemployment: 3.8%"]
        D["VIX: 18.5"]
    end

    subgraph World Model
        E["Financial Layer"]
        F["Macro Layer"]
        G["Regime Latent"]
    end

    subgraph Predict
        H["Recession Prob 3M: 12%"]
        I["Credit Stress: 0.35"]
        J["Rate Path: cutting"]
        K["AAPL Fair Value: ..."]
    end

    A --> E
    B --> F
    C --> F
    D --> E
    E --> G
    F --> G
    G --> H
    G --> I
    G --> J
    G --> K
Data sources: FRED (39 macro series), Yahoo Finance (equities, FX, commodities, crypto), earnings data for tracked firms.
What the model learns: How inflation expectations propagate through the yield curve. How labor market tightness affects Fed policy. How equity risk premia respond to credit conditions. All through shared latent structure -- no hand-coded rules.
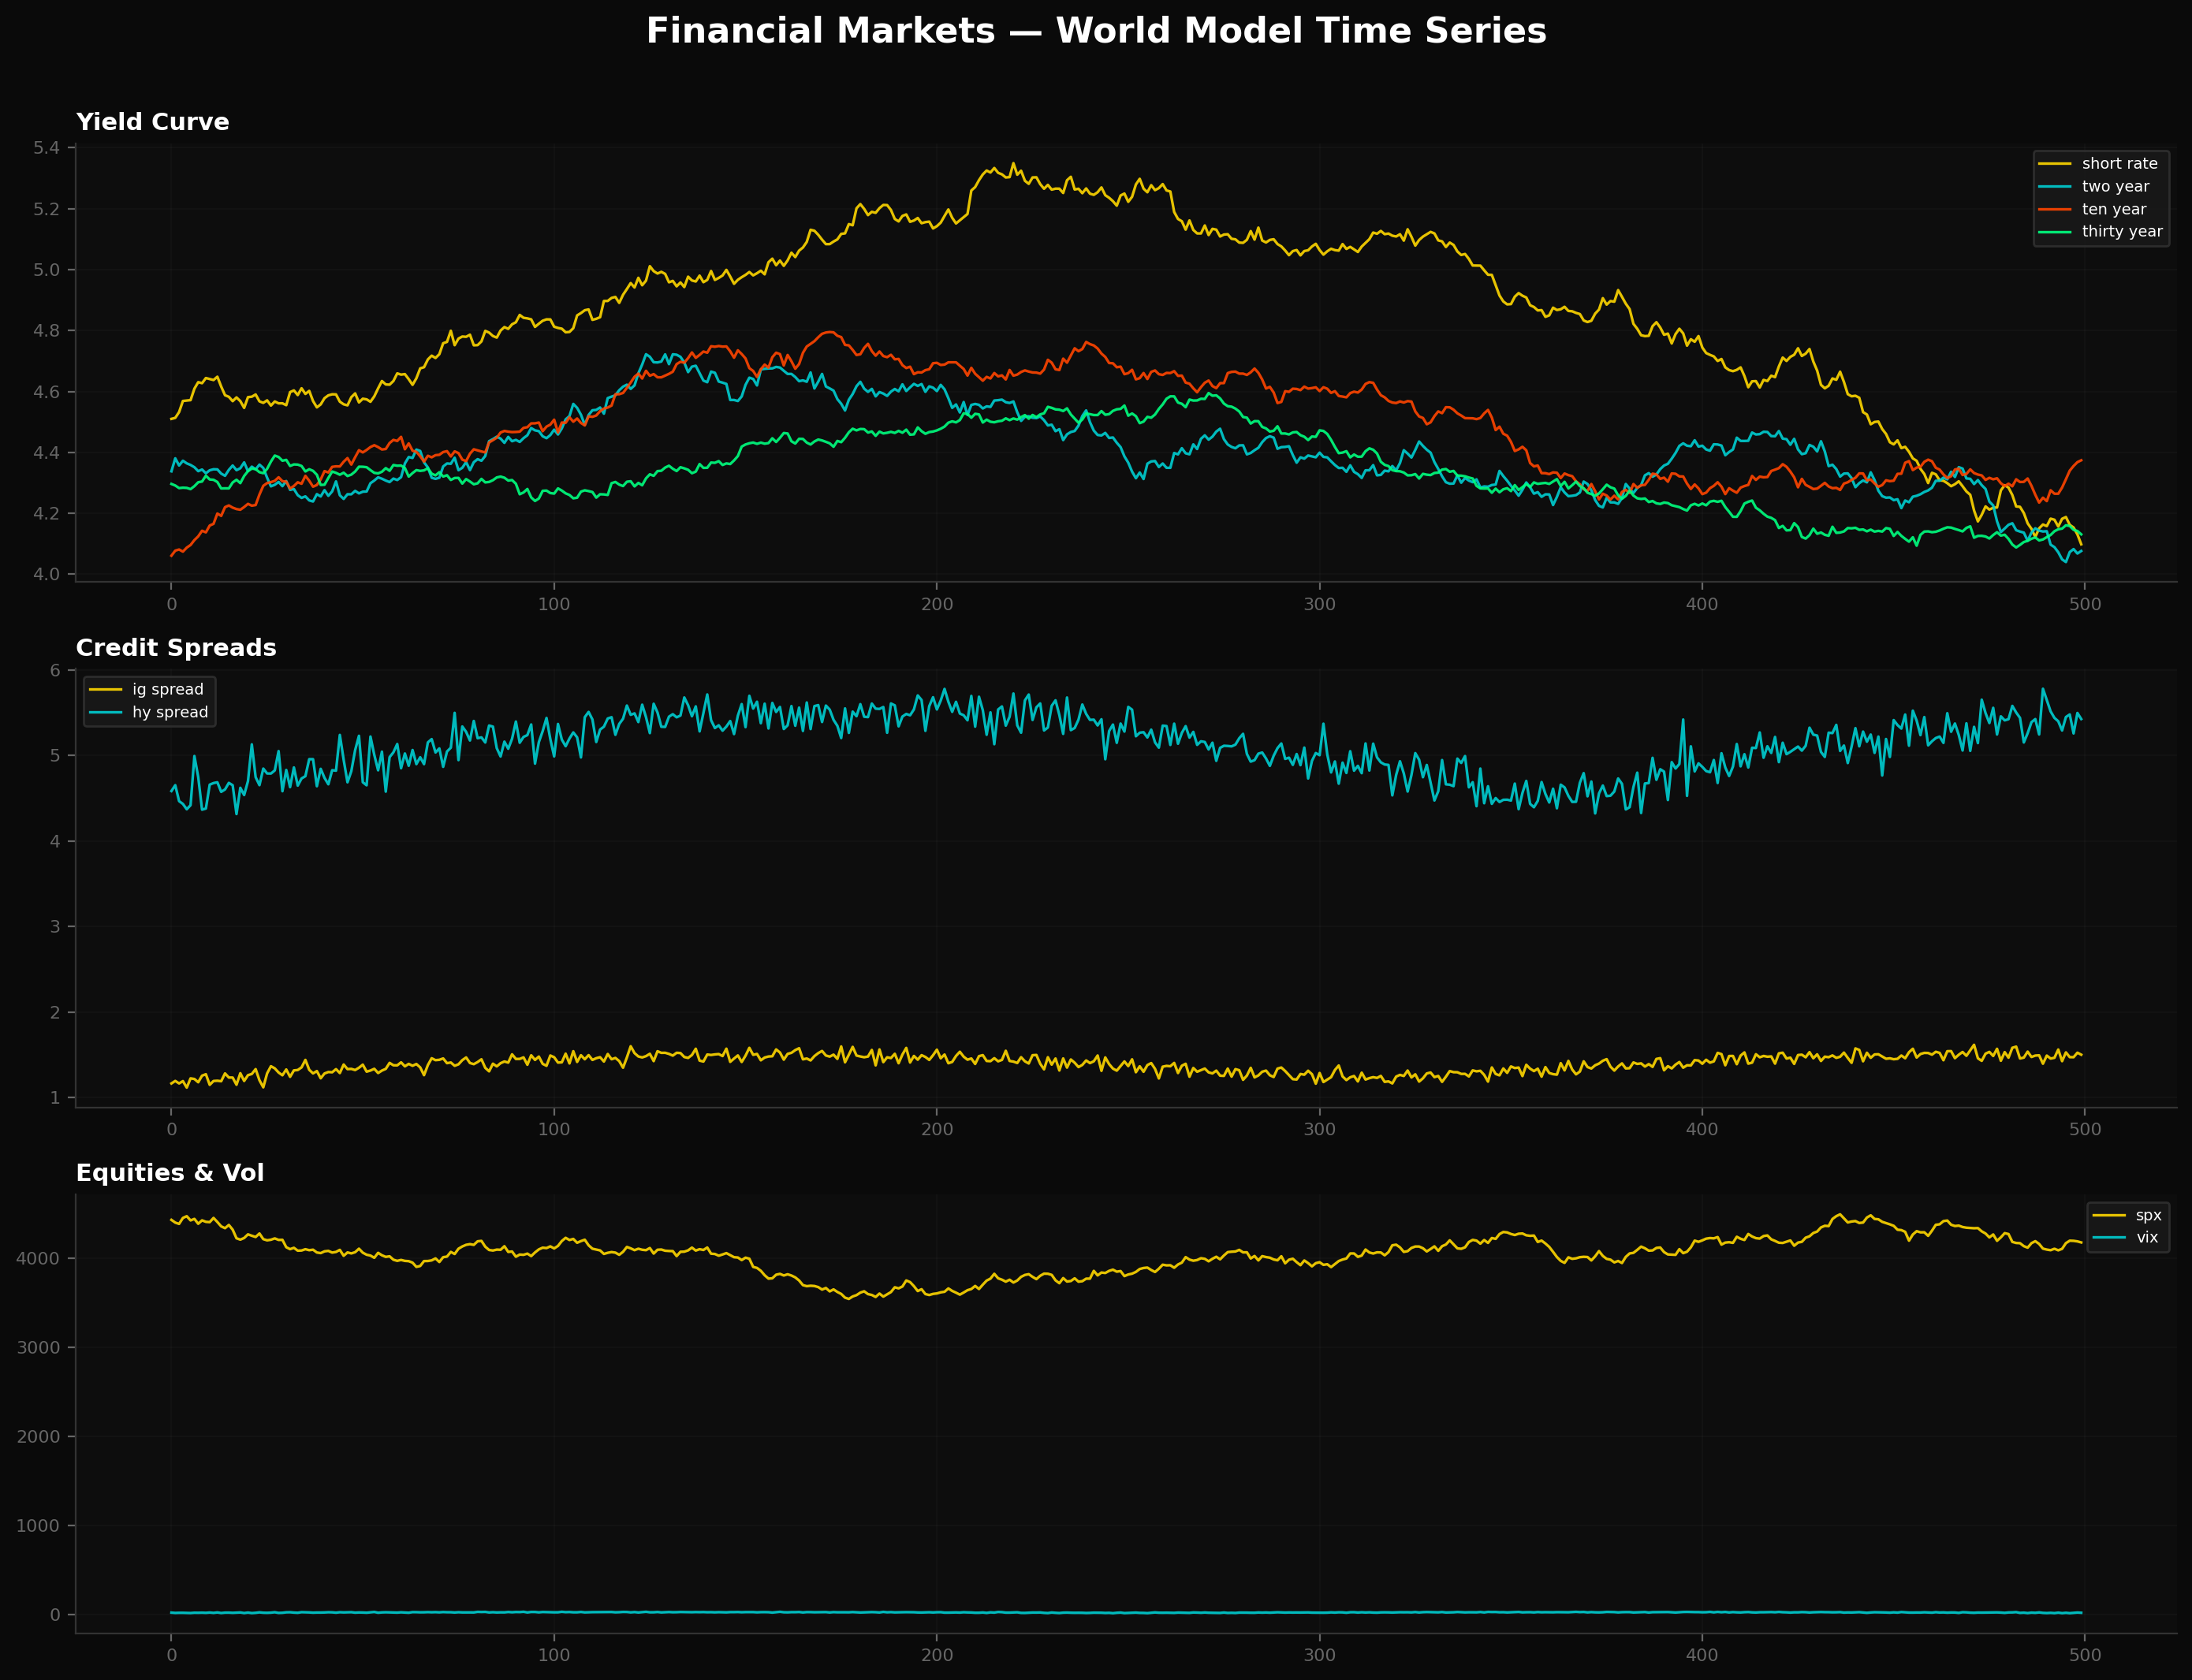
Source: examples/05_train_financial.py
Geopolitical Risk & Commodity Exposure
Who: Commodities trader, geopolitical analyst, defense strategist
A commodities trader needs to understand how geopolitical tensions affect energy and metals prices.
from general_unified_world_model import World, project
from general_unified_world_model.schema.country import Country

bound = project(
    World(),
    include=[
        "resources",                    # energy, metals, agriculture
        "country_us.politics",          # US policy stance
        "country_cn.politics",          # China policy stance
        "events",                       # news and policy events
        "regime",                       # global regime state
        "forecasts.geopolitical",       # conflict risk
    ],
    entities={
        "country_ru": Country(),        # Russia
        "country_sa": Country(),        # Saudi Arabia
    },
    d_model=64,
)
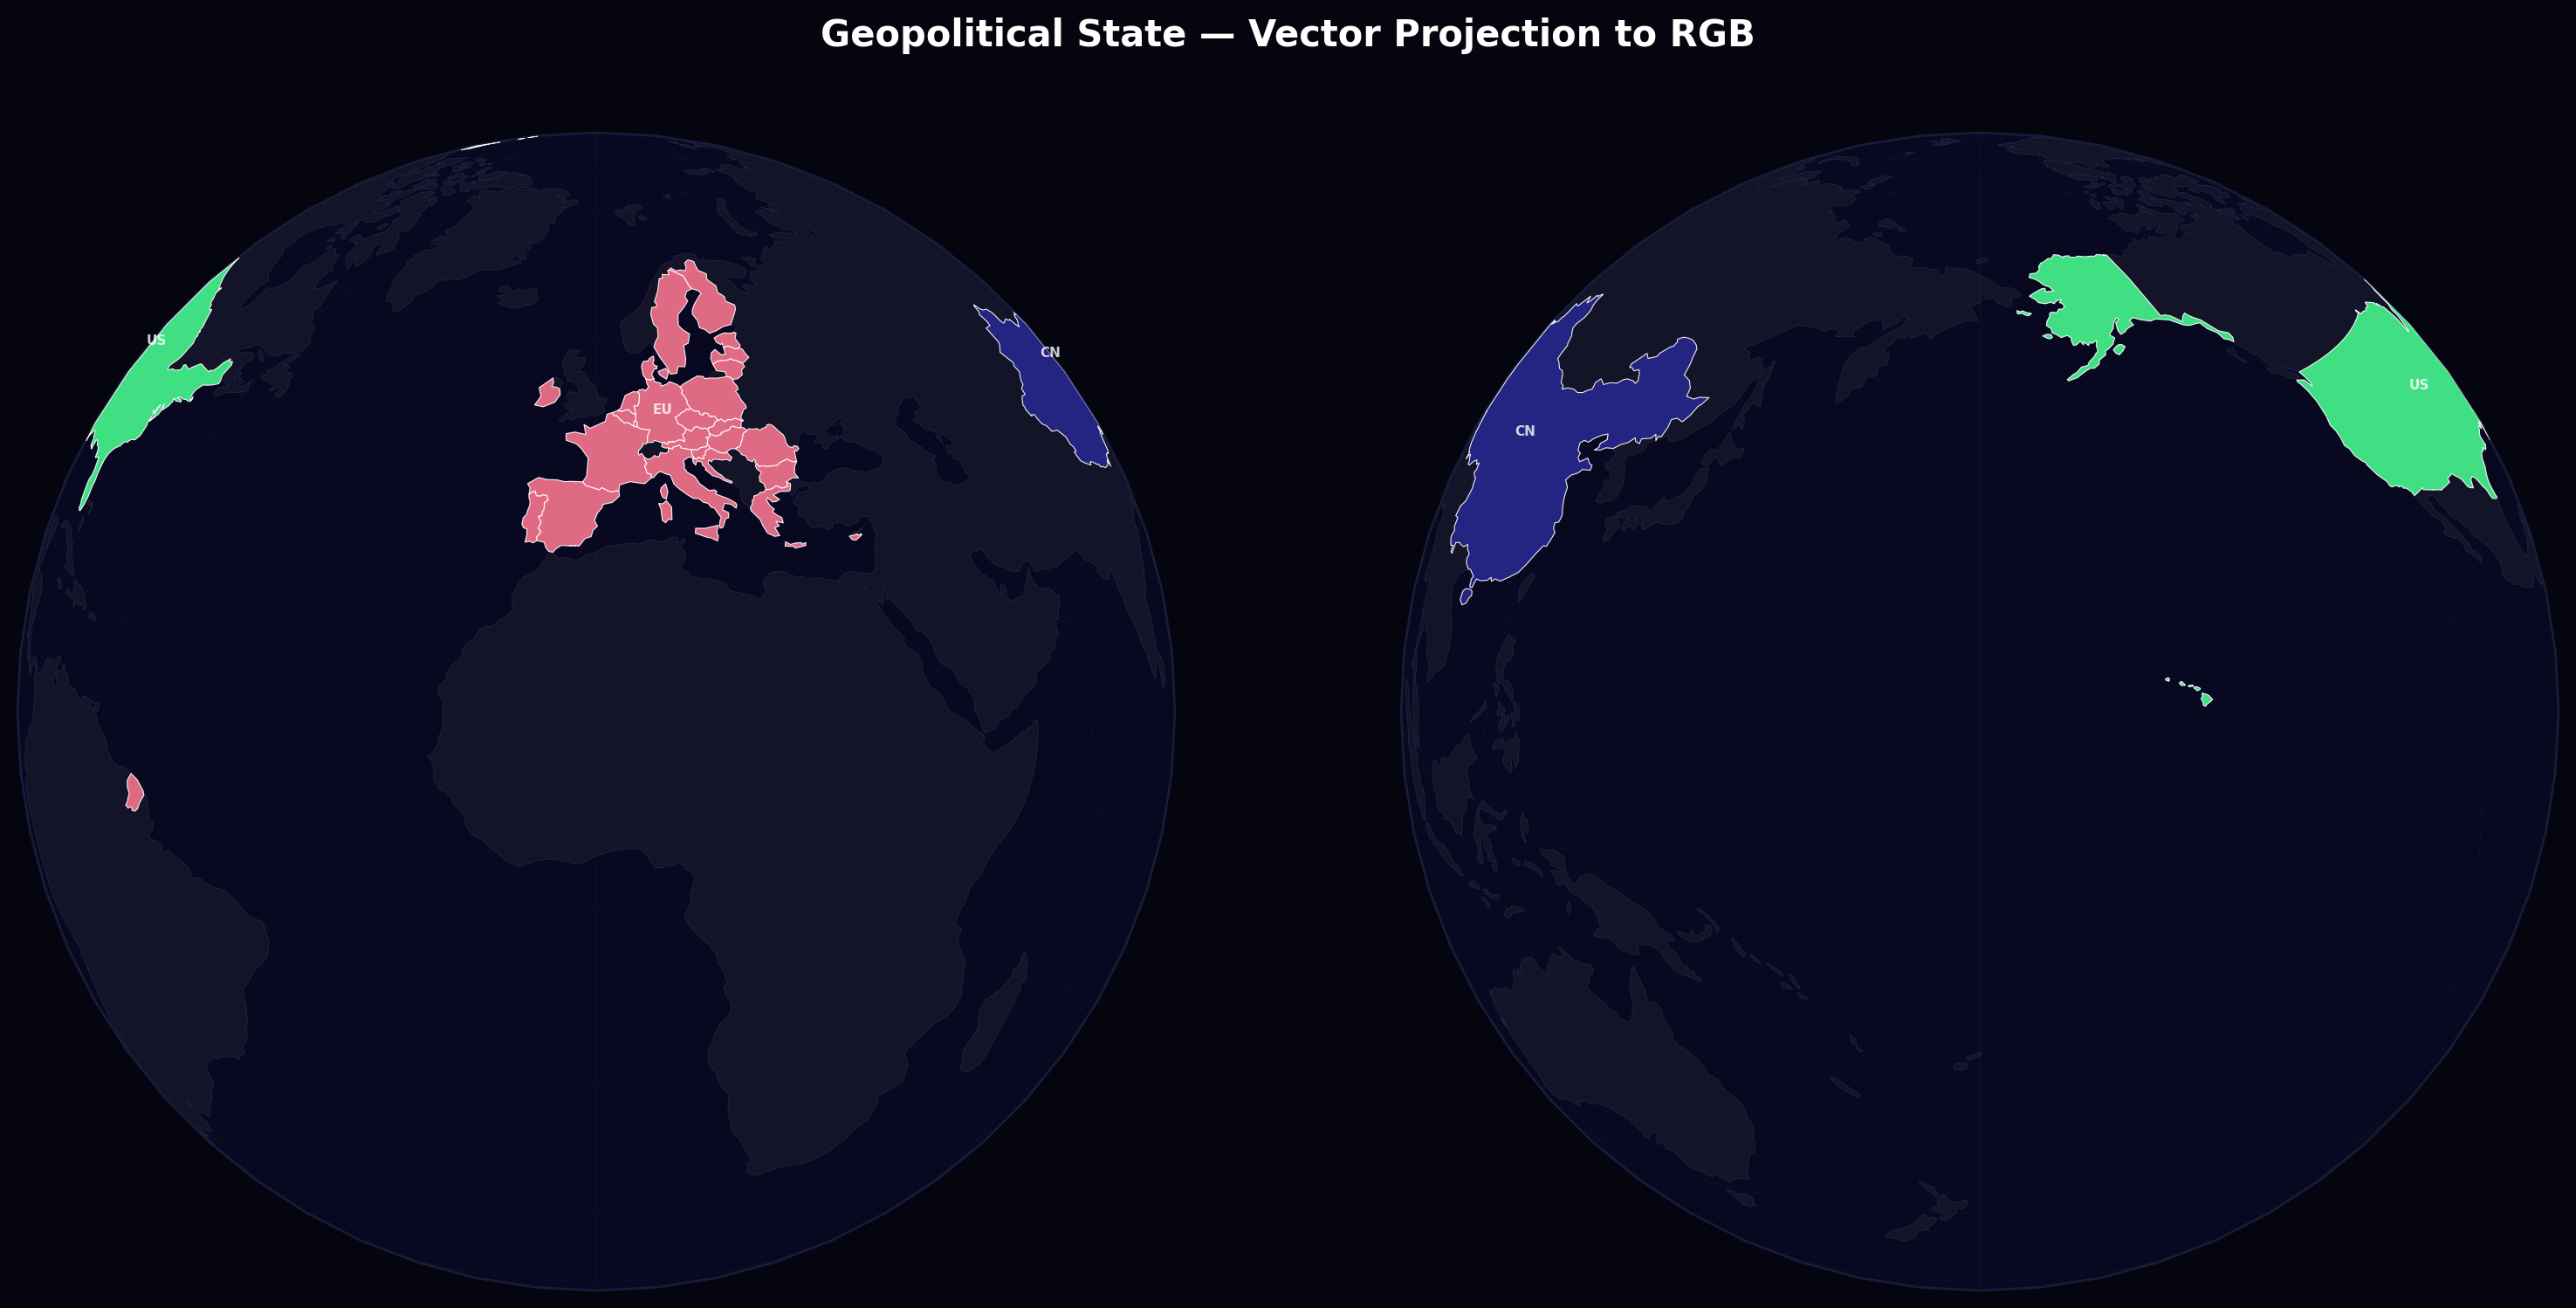
Data sources: Yahoo Finance commodities (CL=F, NG=F, GC=F, SI=F, HG=F), ACLED/UCDP conflict data, GDELT news events.
What the model learns: How sanctions on Russia affect European natural gas. How OPEC+ decisions propagate to copper demand expectations. How conflict risk feeds into gold positioning.
Coming soon: live conflict prediction
Real-time geopolitical event prediction from news embeddings. The rotating globe will update with model predictions as events unfold.
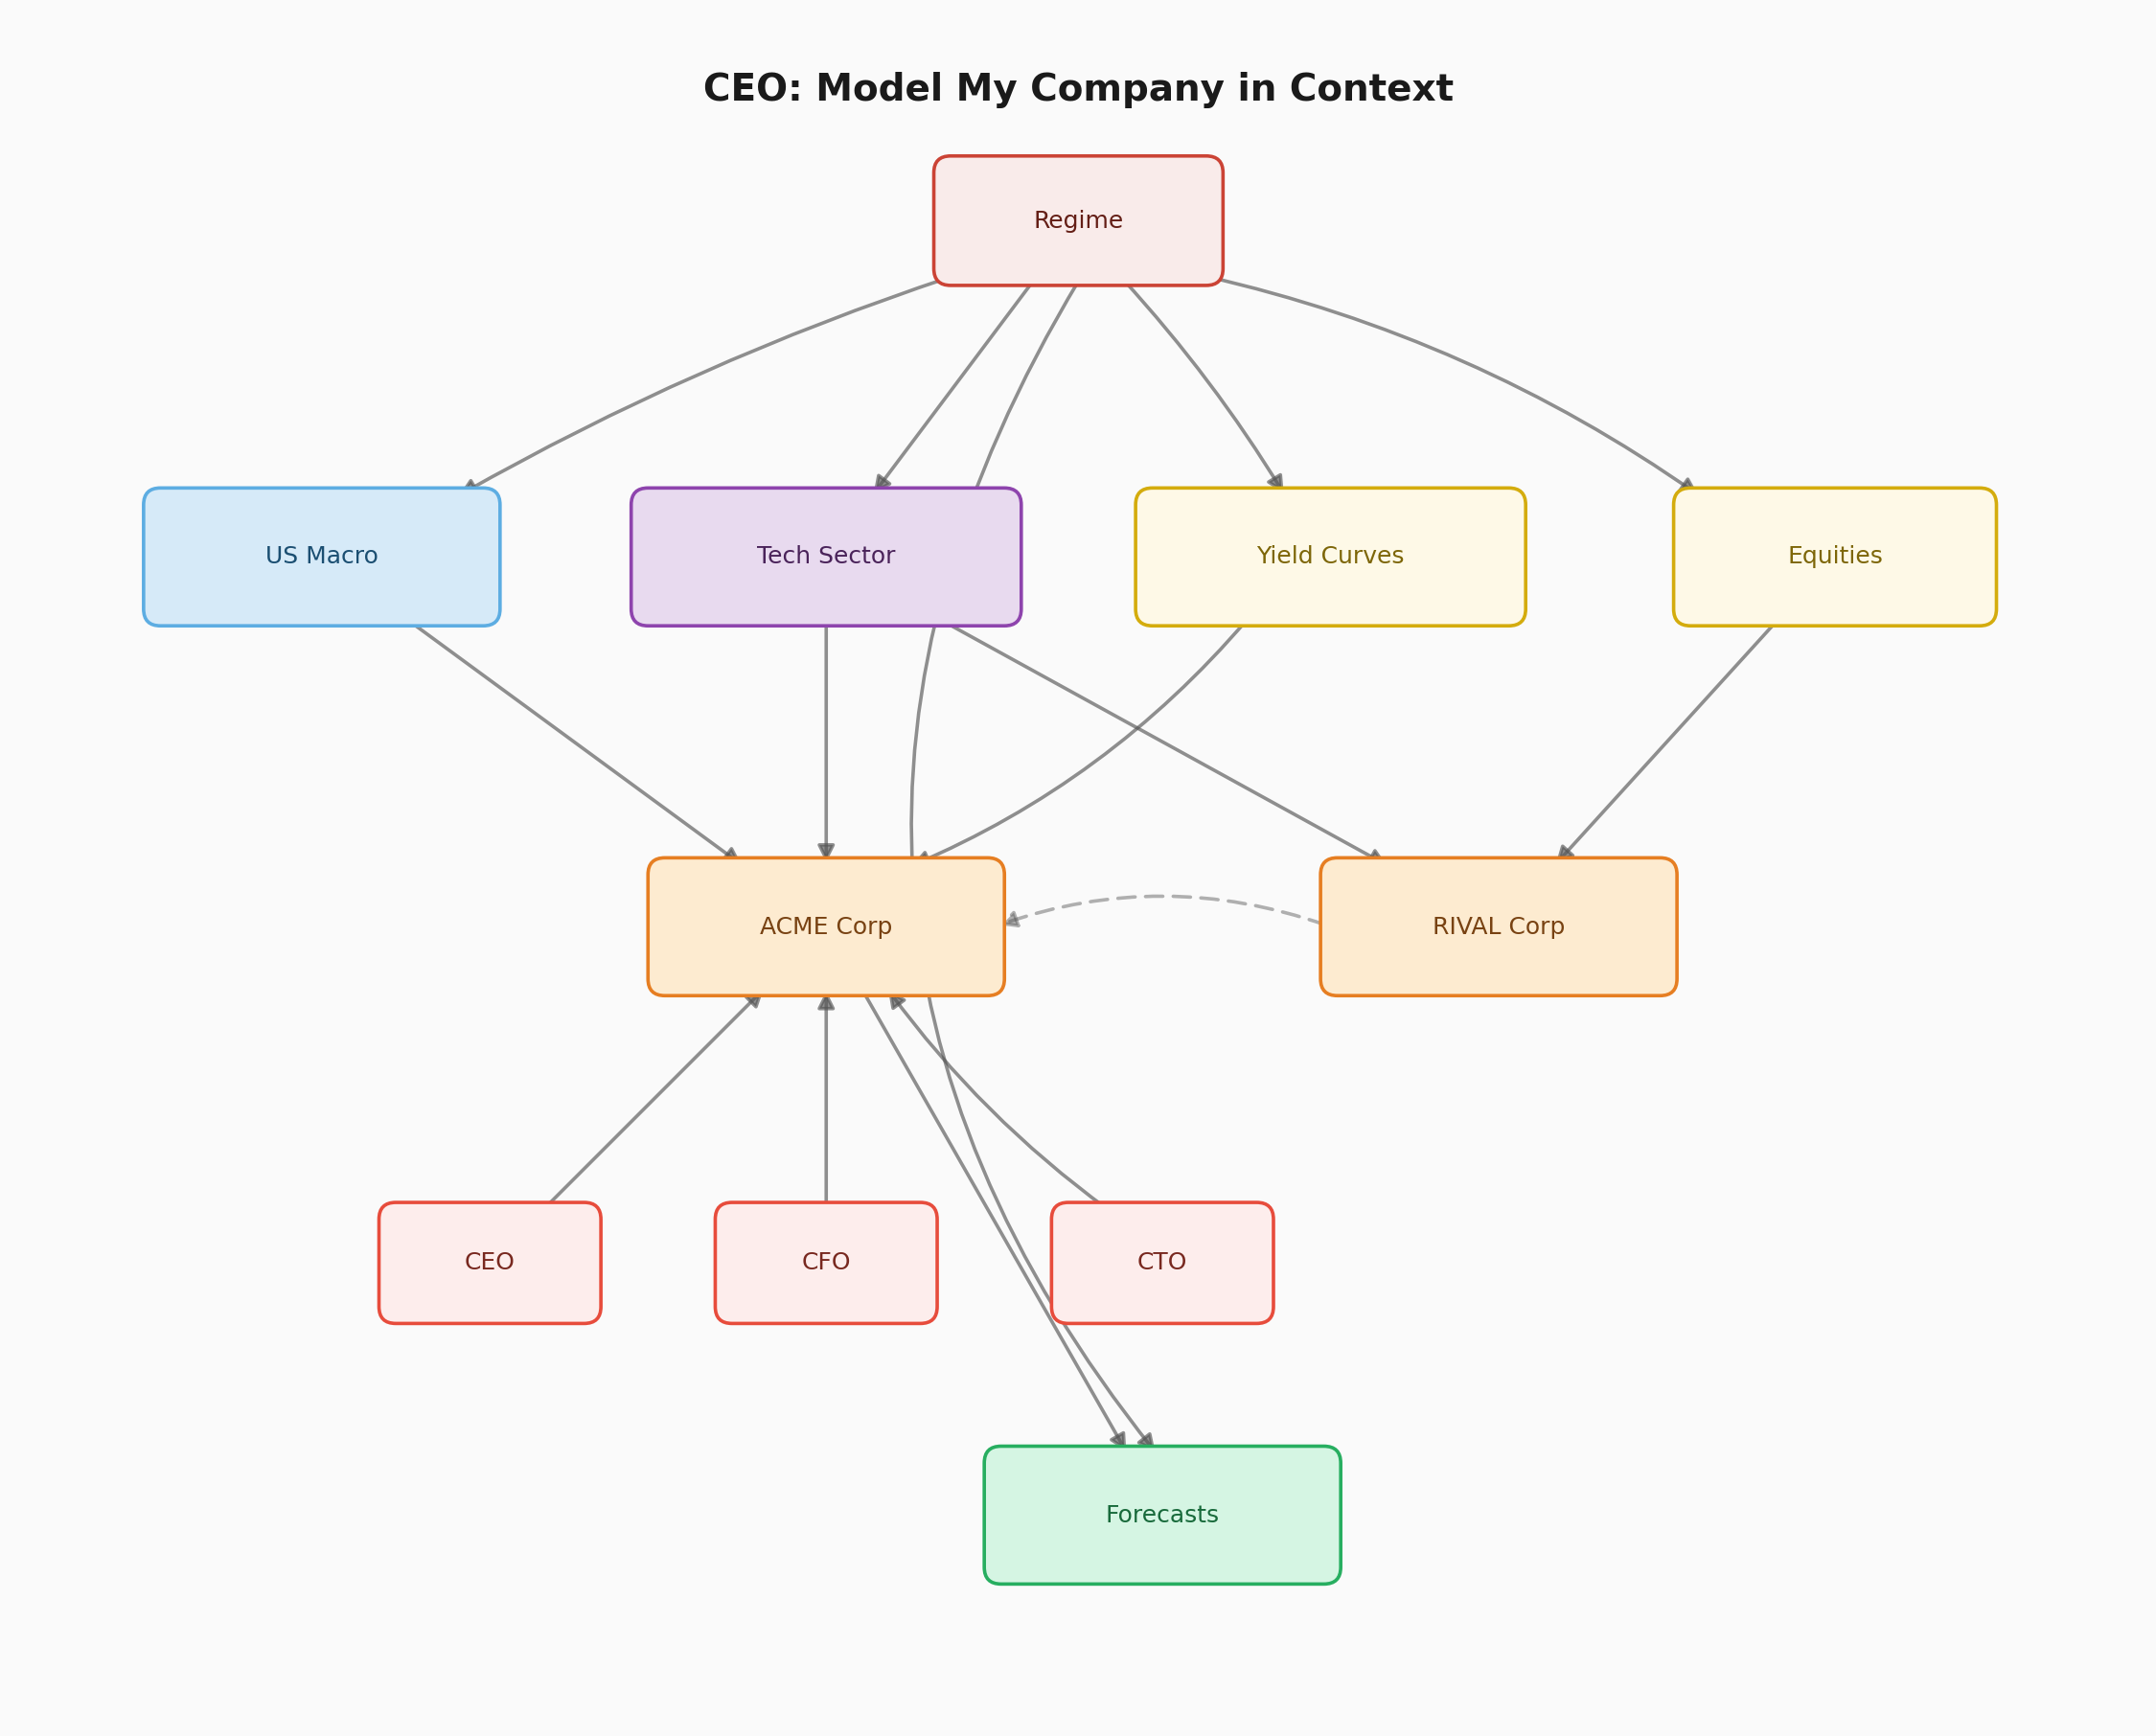
Corporate Strategy & Competitive Intelligence
Who: CEO, CFO, board advisor, strategy consultant
A CEO needs to understand how macro conditions and competitor moves affect their strategic position.
from general_unified_world_model import World, project
from general_unified_world_model.schema.business import Business
from general_unified_world_model.schema.individual import Individual

bound = project(
    World(),
    include=[
        "financial.equities",
        "country_us.macro",
        "regime",
        "forecasts.business",
        "narratives.elites",
    ],
    entities={
        "firm_ACME": Business(),
        "firm_RIVAL": Business(),
        "person_ceo": Individual(),
        "person_cfo": Individual(),
        "person_board_chair": Individual(),
    },
    d_model=64,
)
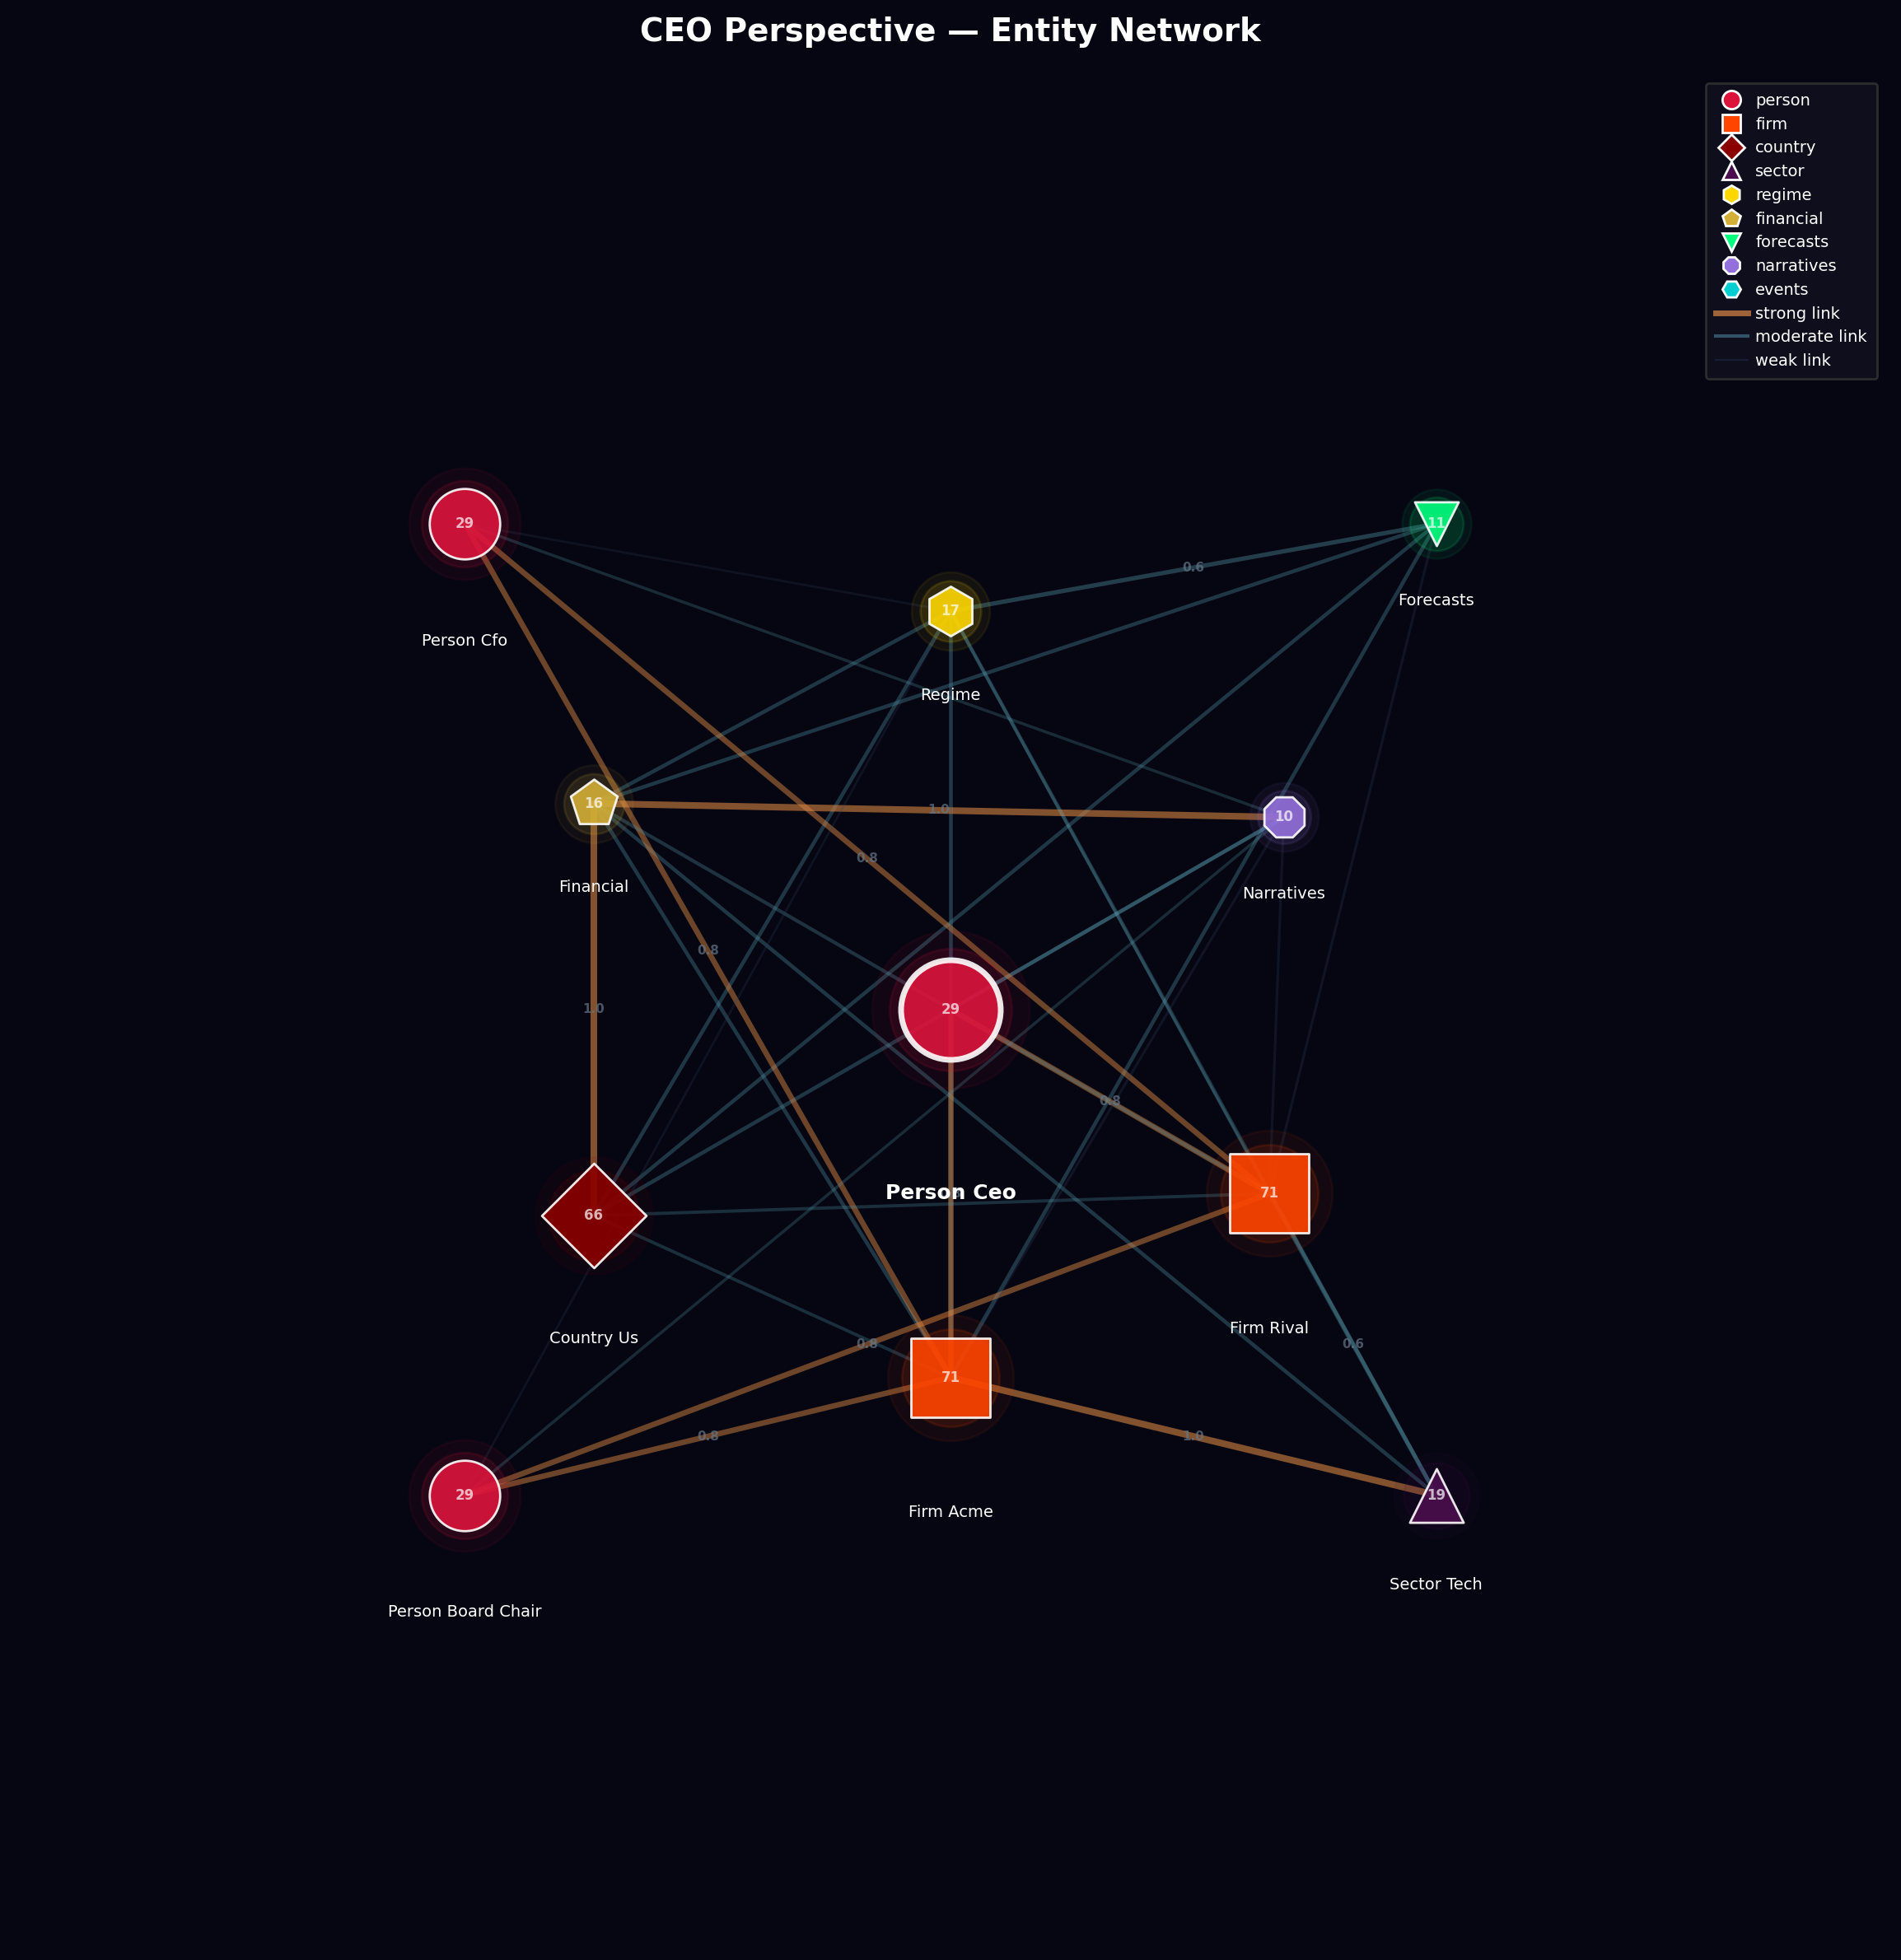
Data sources: Yahoo Finance equity prices, quarterly earnings (revenue, margins, R&D spend), FRED macro context.
What the model learns: How macro conditions drive consumer spending (and therefore AAPL revenue). How NVDA's data center demand correlates with Fed policy (cheap money -> tech capex). How competitive dynamics between firms create correlated risks.
Source: examples/02_ceo_company_model.py
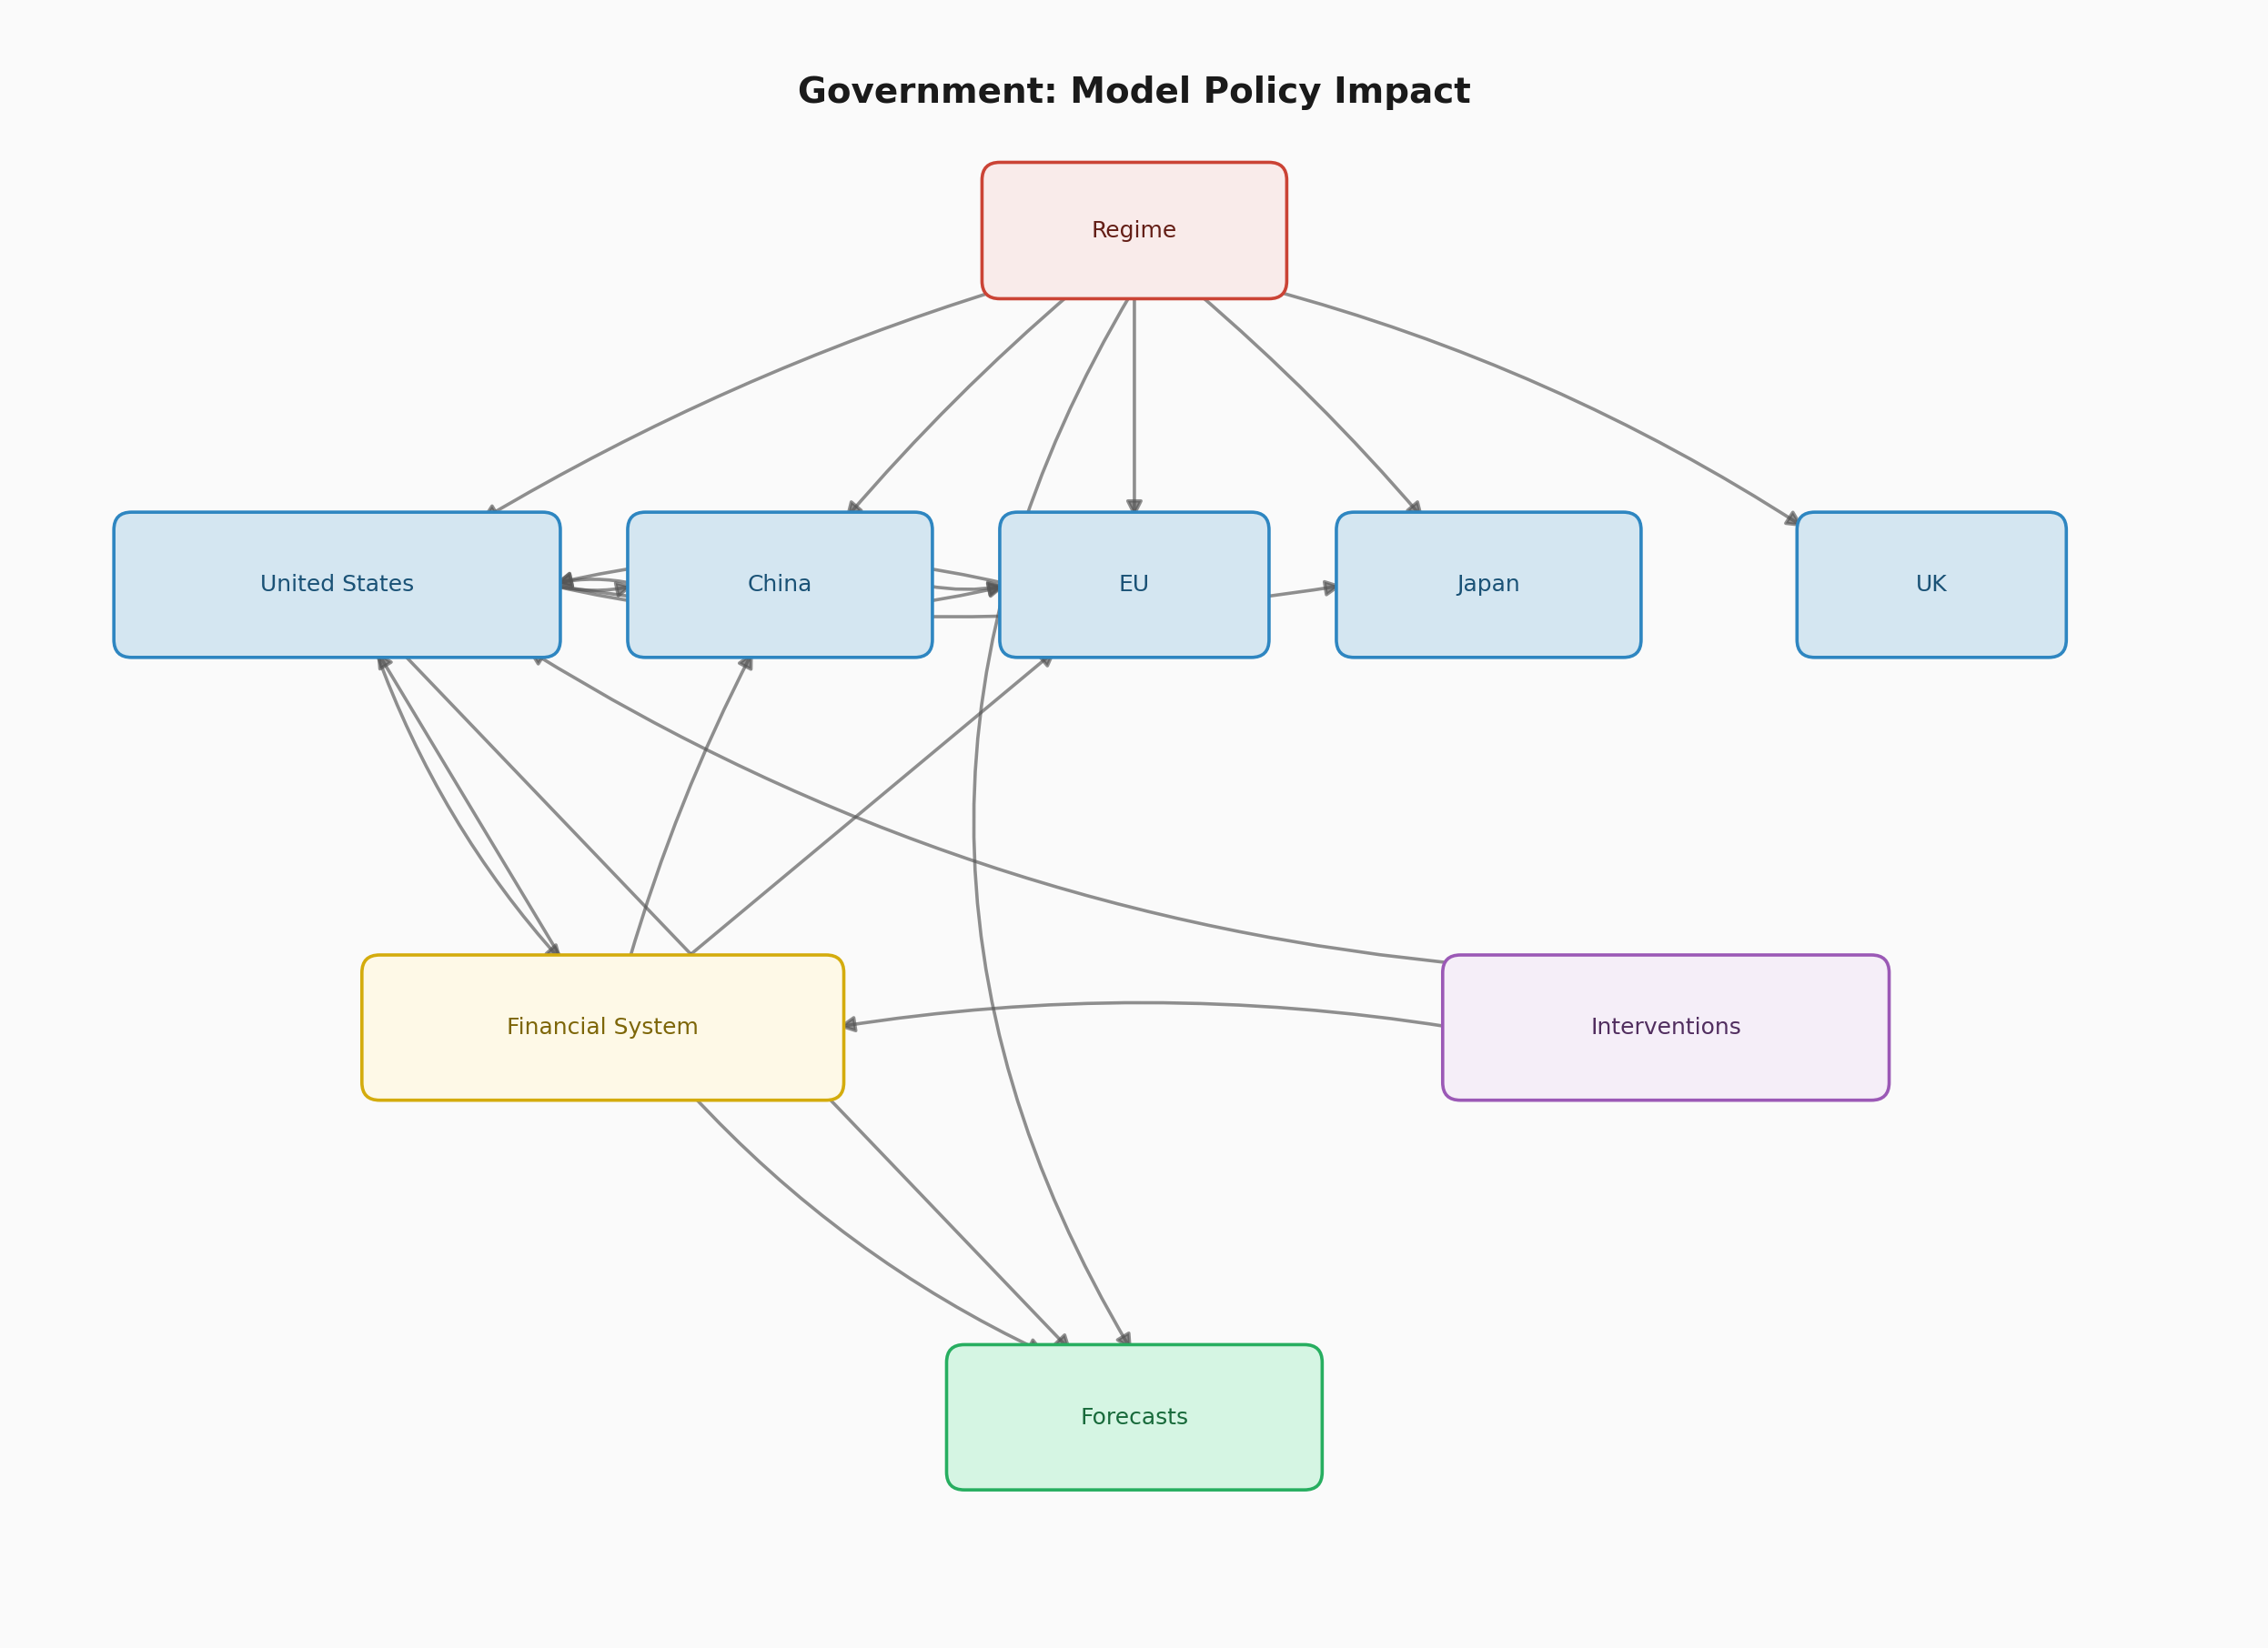
Government Policy Impact Analysis
Who: Central bank economist, Treasury analyst, policy advisor
A central bank economist needs to understand how monetary policy transmits through the economy.
from general_unified_world_model import World, project
from general_unified_world_model.schema.country import Country

bound = project(
    World(),
    include=[
        "country_us",               # full US: macro + politics
        "financial",                 # markets respond to policy
        "interventions",             # monetary + fiscal tools
        "regime",
        "forecasts",
    ],
    entities={
        "country_cn_extra": Country(),
        "country_eu_extra": Country(),
        "country_jp": Country(),
        "country_uk": Country(),
    },
    d_model=128,
)
graph LR
    subgraph Policy Action
        A["Fed Funds Rate: 5.25%"]
        B["QT: $95B/month"]
        C["Forward Guidance"]
    end

    subgraph Transmission
        D["Yield Curve"]
        E["Credit Conditions"]
        F["Housing"]
        G["Labor Market"]
    end

    subgraph Outcomes
        H["GDP Growth"]
        I["Inflation"]
        J["Financial Stability"]
    end

    A --> D
    A --> E
    B --> D
    C --> D
    D --> F
    E --> F
    E --> G
    F --> H
    G --> H
    G --> I
    E --> J
Data sources: FRED (50+ series covering yields, credit, labor, housing, sentiment), IMF WEO forecasts, BIS cross-border statistics.
What the model learns: The full transmission mechanism from policy rate changes through the yield curve, credit conditions, housing, and labor markets to GDP and inflation outcomes. Cross-country spillovers from US monetary policy to emerging markets.
Source: examples/03_government_policy.py
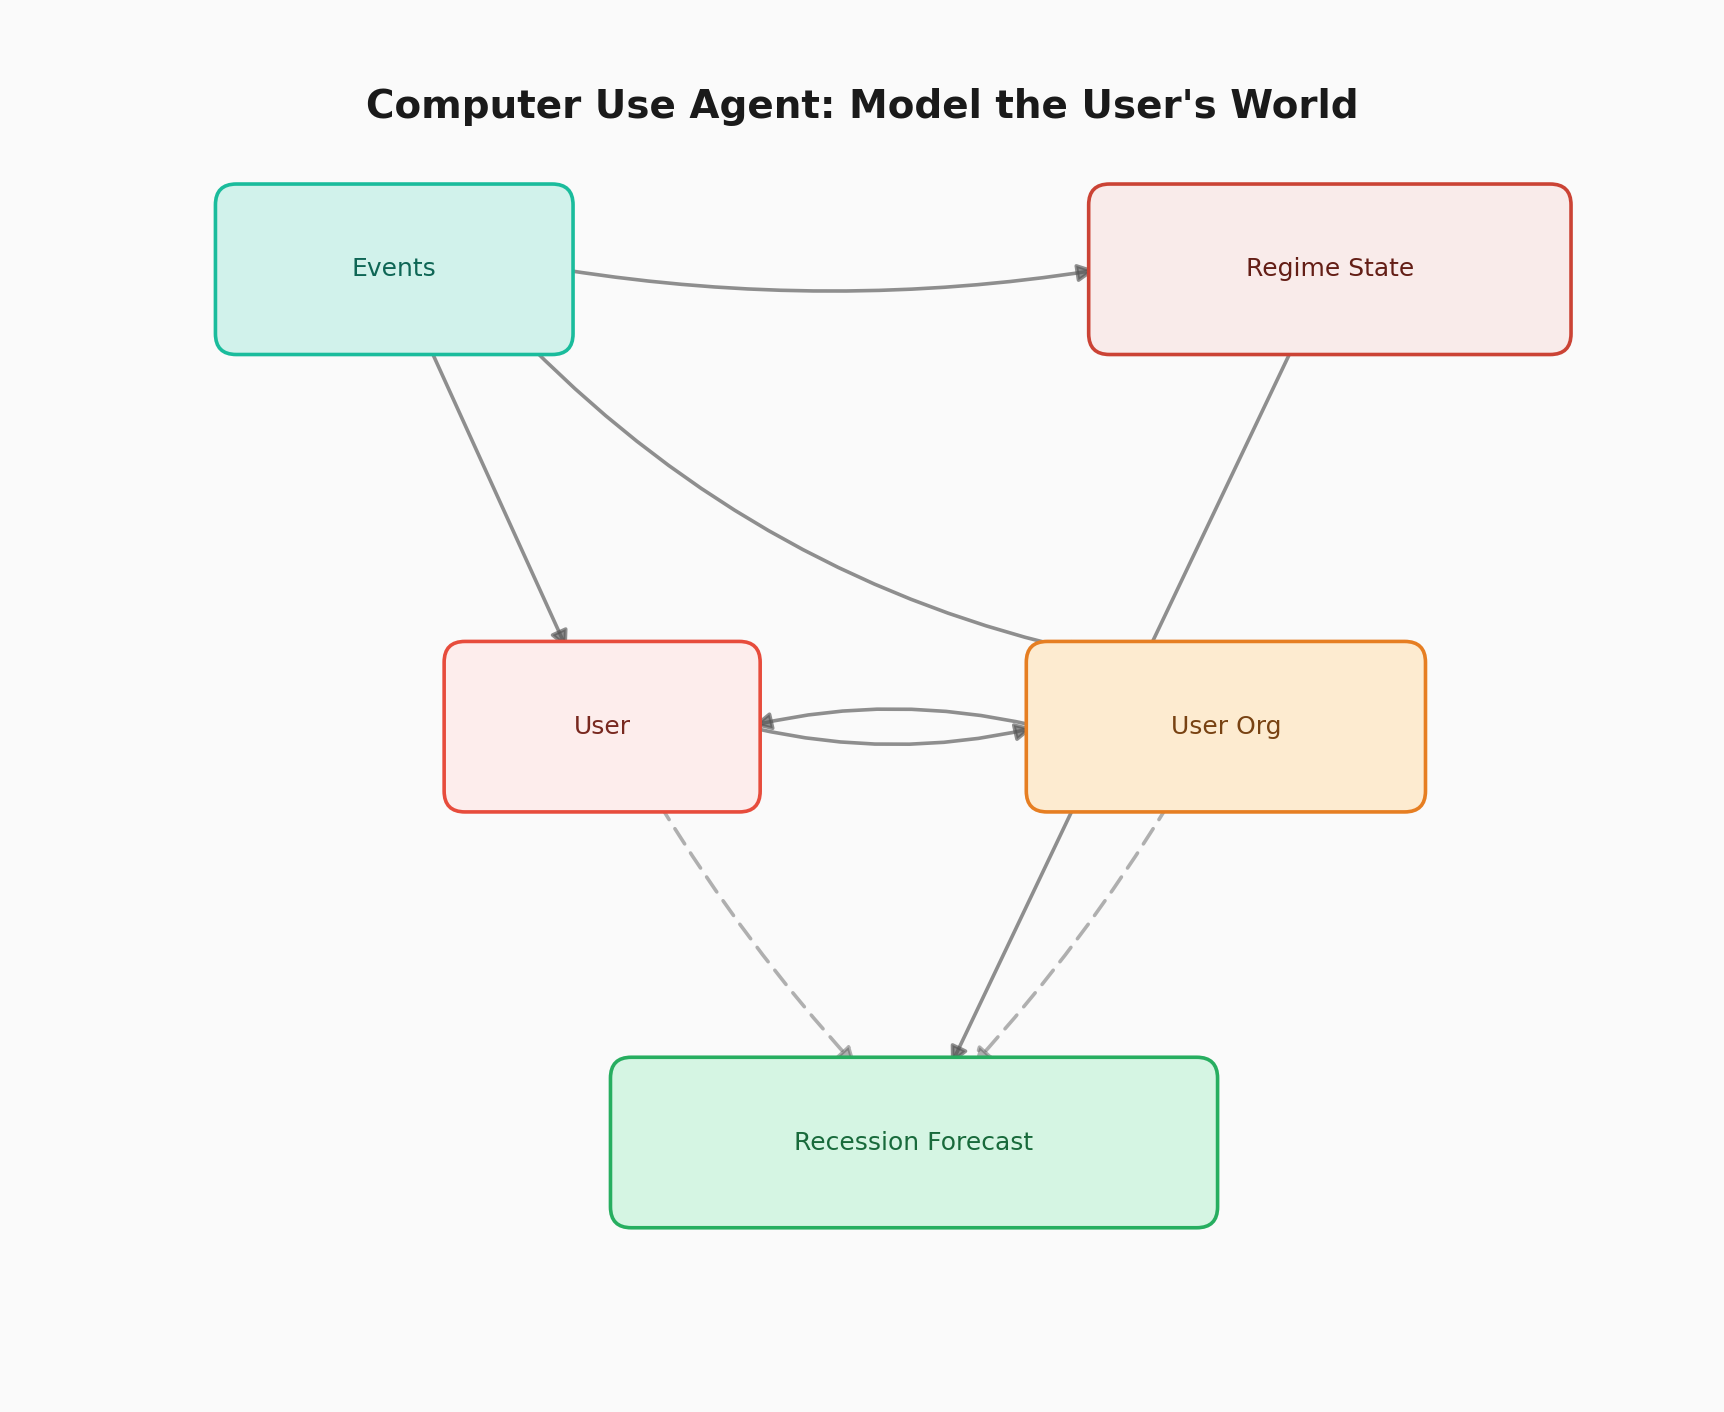
AI Agent World Context
Who: AI agent developers, autonomous system designers
An AI agent operating in the real world needs a compressed understanding of "what's happening" to make better decisions.
from general_unified_world_model import GeneralUnifiedWorldModel

model = GeneralUnifiedWorldModel(
    include=[
        "narratives",          # what people are saying
        "events",              # what just happened
        "regime",              # world mode
        "technology",          # tech frontier
        "forecasts",           # where things are heading
    ],
    d_model=64,
)

# The agent queries the world model as context
model.observe("events.news_embedding", latest_news_embedding)
context = model.predict()
# context["regime.growth_regime"] -> "expansion"
# context["forecasts.macro.recession_prob_3m"] -> 0.08
What the model provides: A structured, calibrated summary of world state that an agent can use for decision-making. Instead of raw news feeds, the agent gets a compressed latent that captures cross-domain dynamics.
Source: examples/04_computer_use_agent.py
Custom Dataset Integration
Any dataset can be integrated by declaring InputSpec and OutputSpec mappings:
from general_unified_world_model import DatasetSpec, InputSpec, OutputSpec

# Map your private data to world model fields
my_spec = DatasetSpec(
    name="Internal Risk Model",
    input_specs=[
        InputSpec(
            key="credit_score",
            semantic_type="Corporate credit risk score",
            field_path="financial.credit.ig_spread",
        ),
        InputSpec(
            key="revenue_forecast",
            semantic_type="Quarterly revenue forecast",
            field_path="firm_ACME.financials.revenue",
        ),
    ],
    output_specs=[
        OutputSpec(
            key="default_prob",
            semantic_type="Default probability",
            field_path="forecasts.financial.credit_stress",
        ),
    ],
)
The LLM-powered annotator can also do this automatically:
from general_unified_world_model.llm.dataset_annotator import annotate_dataset

spec = annotate_dataset(
    name="my_data",
    columns=["revenue", "eps", "guidance", "sector"],
    sample_values={"revenue": [42.5, 43.1, 44.8], "eps": [1.23, 1.31, 1.42]},
    description="Quarterly earnings data for tech companies",
)
Source: examples/05_train_financial.py
More use cases coming soon
Planned examples
- Healthcare system modeling: Patient outcomes, hospital capacity, pharmaceutical pipeline
- Climate & energy transition: Renewable adoption, carbon pricing, grid reliability
- Supply chain resilience: Semiconductor supply, logistics bottleneck detection
- Election forecasting: Polling, economic indicators, social sentiment → electoral outcomes
- Pandemic early warning: Novel pathogen risk, healthcare capacity, travel restrictions